Wednesday, March 2, 2016
Page 1
Council Reports Slow Increase in Diversity on Bench
By KENNETH OFGANG, Staff Writer
Diversity on the California bench has slowly but steadily increased over the last 10 years, the Judicial Council reported yesterday.
The council is required by statute to annually report demographic data on the ethnicity, race, gender, gender identity, sexual orientation, and veterans’ and disability status of California state justices and judges on the bench. Yesterday’s report is the 10th under that legislation.
“Responding to the questionnaire is entirely voluntary for judges,” the council noted. “On that basis, the report reflects the responses of only those judicial officers that provided demographic data.”
The council reported that, as of Dec. 31, women are 32.9 percent of judges and justices, compared to 27.1 percent when the first annual report was released in 2006.
African Americans and Asian Americans now make up 6.5 percent of the state’s judicial officers, d the council reported, whereas each group constituted 4.4 percent 10 years ago. Judges and justices identifying as Hispanic or Latino are 9.8 percent, compared to 6.3 percent in 2006.
The proportion of judges describing themselves as American Indian or Alaska Native has risen to 0.5 percent from 0.1 percent, and Pacific Islanders now make up 0.2 percent of the bench, up from 0.1 percent. Self-described judges of “Some Other Race” are now 1.2 percent of the bench, up from 0.2 percent, while the number who are of more than one race has declined to 3.4 percent from 4.4 percent.
Whites make up 69.2 percent, compared to 70.1 percent in 2006.
Only 2.6 percent of judges did not provide data at the end of last year, compared to 9.9 percent in 2006.
Sexual Orientation Data
In 2011, the law was amended to add gender identity and sexual orientation to the reporting categories. Of the state’s 1,672 judges, 64.2 percent said they were heterosexual, 1.4 percent lesbian; 1.3 percent gay, and 0.1 percent transgender. No judge reported being bisexual and 33.1 percent either didn’t respond to the survey at all or didn’t answer the question.
Also, this is the second year that the study includes data on veteran’s and disability status. Nine judges reported that they have served in the military and four indicated they have a disability.
The report explained, however, that such information was only requested from judges new to the bench in the last two years, although previously elected or appointed judges did, in a few cases, update their profiles to provide the data.
Data by County
The data was also broken down by county. Los Angeles Superior Court judges were 34.5 percent female, 0.9 percent American Indian or Alaska Native, 9 percent Asian American, 9.4 percent African American, 14.4 percent Hispanic or Latino, 0.4 percent Pacific Islander, 57 percent White, 1.8 percent other, 3.4 percent multiracial, and 3.8 percent not reporting.
Of the county’s 446 judges, 176 did not respond to the question on sexual orientation. Of those who did, four said they were lesbian and six said they were gay.
Two counties had majority-female trial courts—Yuba, with three women out of five, and Contra Costa, with 20 out of 38.
“Increasing the diversity of California’s judicial officers to reflect the rich diversity of California’s populace continues to be a key goal of the Judicial Council,” the council said in a statement.
The Judicial Council’s release followed Friday’s issuance of Gov. Jerry Brown’s statutorily required report on diversity of both judicial appointments and judicial applications.
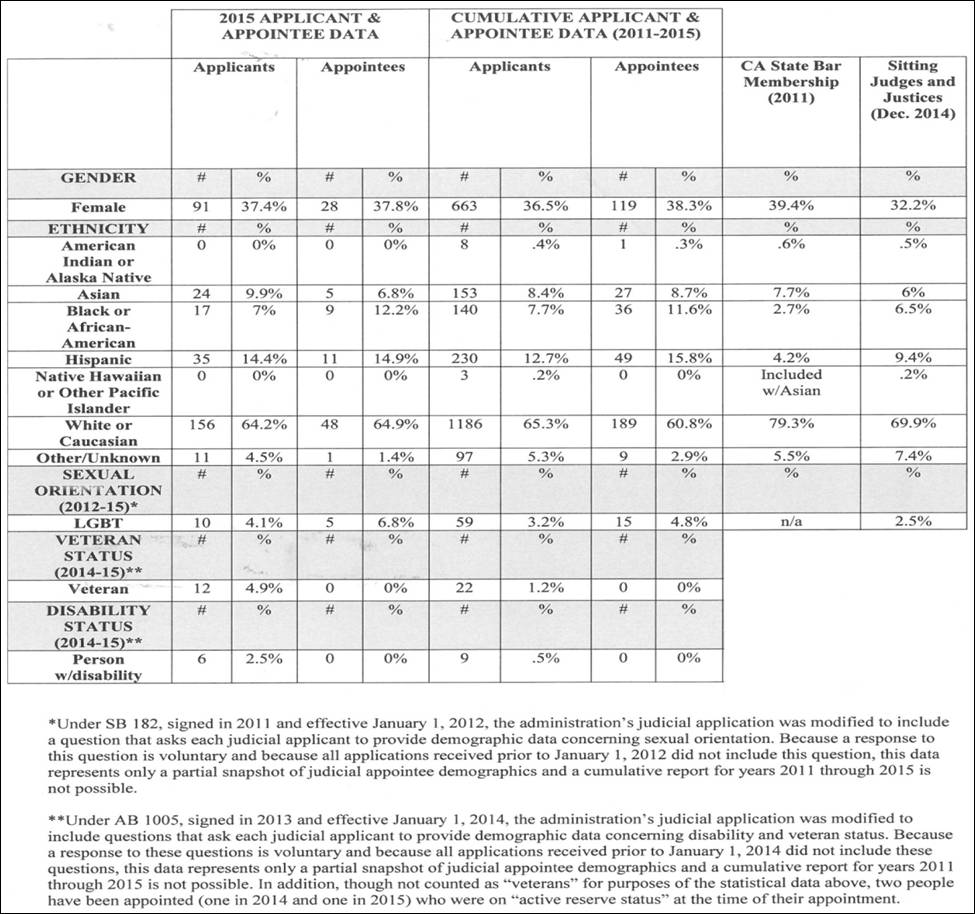
The governor reported that from 2011—the first year of his current tenure—through last year, there were 1,817 applicants for judicial appointments and he appointed 311 judges, including 74 in 2015. Approximately 35 percent of the applicant pool and 39 percent of those appointed identified themselves as American Indian or Alaska Native; Asian; Black or African-American; Hispanic; Native Hawaiian or Other Pacific Islander; or Other/Unknown.
The Governor’s Office provided the following table summarizing its data:
|
|
Copyright 2016, Metropolitan News Company